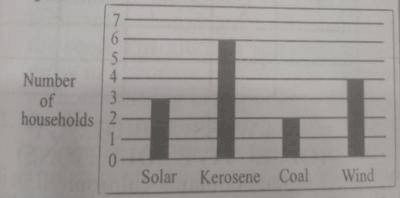
Concept:In a bar chart, the category with the tallest bar has the highest value or frequency.Explanation:The chart compares different sources of energy used for cooking.Each source has a bar whose height represents how many households use it.The taller the bar, the more popular that source of energy is in the community.Reading the chart: solar 3, kerosene 6, coal 2, wind 4 households.Kerosene has the tallest bar (6 households).Therefore, kerosene is the most commonly used source of energy for cooking in the community.Answer:Option B (Kerosene)