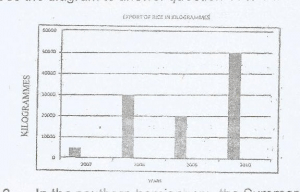
Concept:The year with the highest production of rice is the one showing the highest value or peak on the graph.Explanation:Compare the rice export values for 2007, 2008, 2009, and 2010 as shown in the diagram.The tallest bar or highest point on the graph represents the greatest production of rice.In the diagram, the highest point occurs in 2010.Hence, Country X produced the most rice in that year.Answer:D. 2010