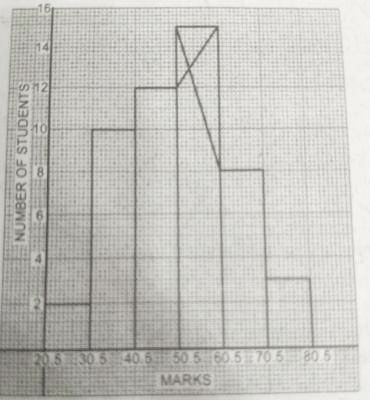
Concept:The mode of a grouped distribution is estimated from the modal class using its boundaries and the frequencies of neighbouring classes.Explanation:From the given histogram, the tallest bar shows the modal class as 50.5 to 55.5.So, the lower class boundary is L=50.5 and the class width is h=5.The frequency of the modal class is fm=10.The frequency of the class just before it is fm−1=7.The frequency of the class just after it is fm+1=8.For grouped data, the mode is calculated by:Mode=L+(fm−fm−1)+(fm−fm+1)fm−fm−1×hSubstitute the values:Mode=50.5+(10−7)+(10−8)10−7×5Mode=50.5+3+23×5Mode=50.5+53×5=50.5+3=53.5Answer:C. 53.5