Africa Exams
Where Preparation Meets Success
Home
Botswana
Botswana PSLE Papers
Botswana JCE Papers
Botswana BGCSE Papers
Ghana
Ghana BECE Exams
Kenya
Kenya KCPE Papers
Kenya KCSE Papers
Kenya KASNEB Papers
Nigeria
WAEC Exams
JAMB Exams
Rwanda
Rwanda Primary Papers
Rwanda Secondary Papers
Uganda
Uganda PLE Papers
Uganda UCE Papers
Uganda UACE Papers
Certifications
Technical
Cloud Tech Certifications
Security Tech Certifications
Management
IT Infrastructure
More
About
Contact Us
Our Apps
Privacy
+
-
Test Index
WAEC Physics 2024 Paper
Show Para
Hide Para
Share question:
© africaexams.com
Question : 50
Total: 50
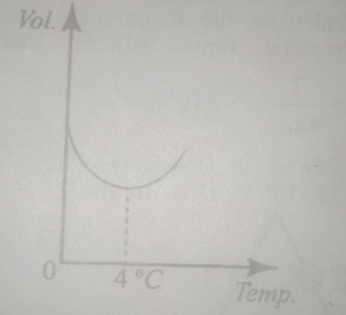
The diagram above illustrates the graph for
the variation of the volume of a gas with increasing temperature
expansion curve of mercury
expansion curve of liquid oxygen
anomalous expansion of water
Validate
Solution:
The given graph illustrates the anomalous expansion of water, where water has its highest density and consequently its lowest volume at 4ºC
© africaexams.com
Go to Question:
1
2
3
4
5
6
7
8
9
10
11
12
13
14
15
16
17
18
19
20
21
22
23
24
25
26
27
28
29
30
31
32
33
34
35
36
37
38
39
40
41
42
43
44
45
46
47
48
49
50
Prev Question