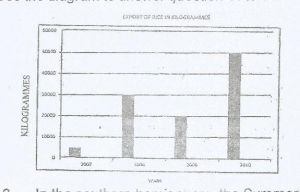
Concept:The value for the year 2010 is read directly from the vertical axis of the bar chart.Explanation:The diagram shows rice exports in Kilogrammes from Country X for each year from 2007 to 2010.Look at the bar or point that represents 2010 on the horizontal axis.Trace the top of that bar across to the vertical axis.The vertical axis is marked in Kilogrammes, and the 2010 value reaches the 60,000 Kilogrammes mark.Therefore, the quantity of rice produced in 2010 is 60,000 Kilogrammes.This matches option D.Answer:D. 60,000 Kilogrammes