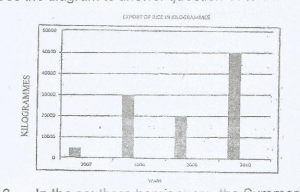
Concept:A line graph uses points connected by straight lines to show data changes over a period of time.Explanation:The diagram plots rice exports, in kilogrammes, from Country X for each year from 2007 to 2010.Because the data is presented as a series of points joined by a line, the diagram is best described as a line graph.It is used to show trends or changes over time.Answer:A. Line graph