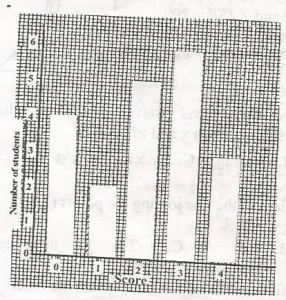
Concept: A bar chart shows how many students obtained each score; the total number of test-takers is the sum of all the bar heights (frequencies).Explanation:Read the height of each bar as the number of students with that score. From the chart: Score 0: 4 students Score 1: 2 students Score 2: 5 students Score 3: 6 students Score 4: 3 students Therefore, total number of students is: 4+2+5+6+3=20 Thus, 20 students took the test.Answer: C. 20